Simple and useful graphical statistics generated from your Kippo honeypot
For more, visit the other pages/components of in this package
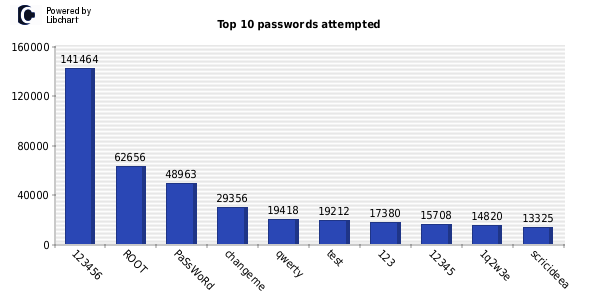
Top 10 passwords
This vertical bar chart diplays the top 10 passwords that attackers try when attacking the system.
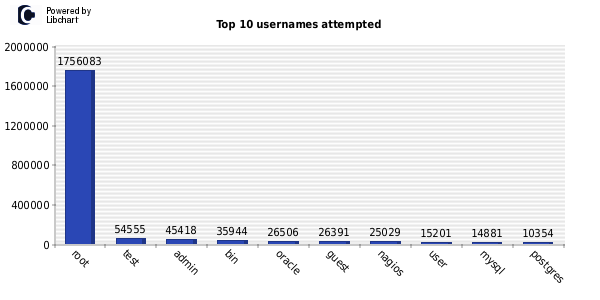
Top 10 usernames
This vertical bar chart diplays the top 10 usernames that attackers try when attacking the system.
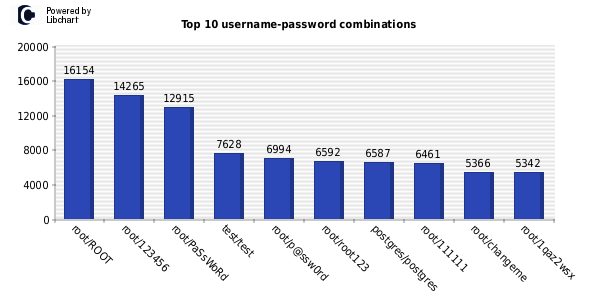
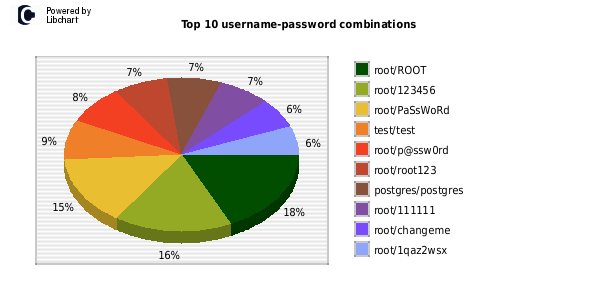
Top 10 user-pass combos
This vertical bar chart diplays the top 10 username and password combinations that attackers try when attacking the system.
This pie chart diplays the top 10 username and password combinations that attackers try when attacking the system.
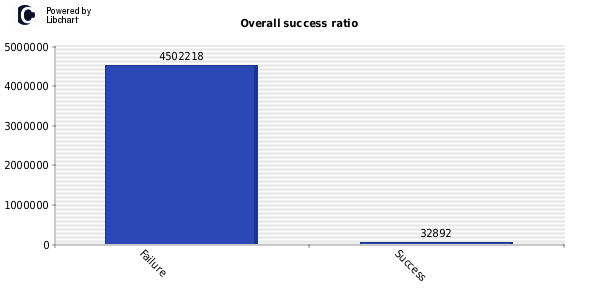
Success ratio
This vertical bar chart diplays the overall attack success ratio for the particular honeypot system.
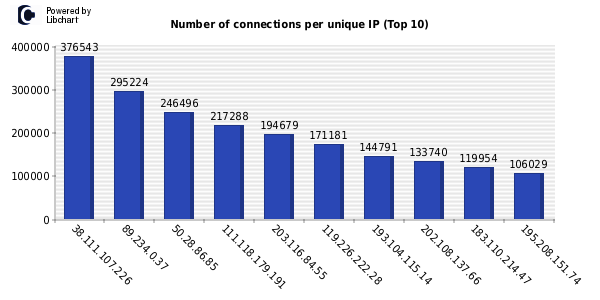
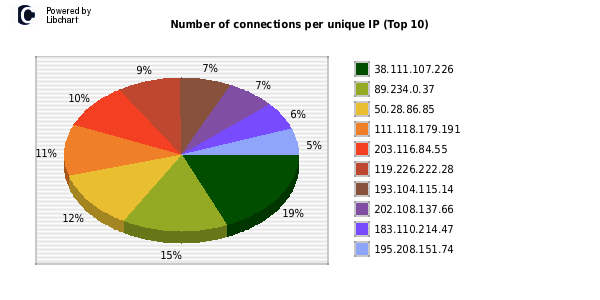
Connections per IP
This vertical bar chart diplays the top 10 unique IPs and country codes ordered by the number of overall connections to the system.
This pie chart diplays the top 10 unique IPs and country codes ordered by the number of overall connections to the system.
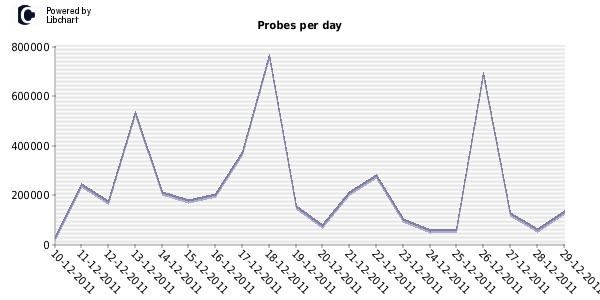
Probes per day
This line chart diplays the daily activity on the honeypot system. Spikes indicate hacking attempts.
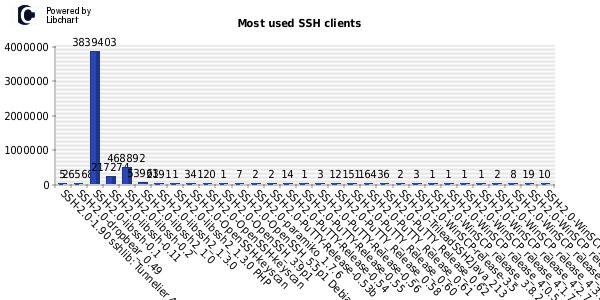
SSH clients
This vertical bar chart diplays the most common SSH clients used by attackers during their hacking attempts.